Overview
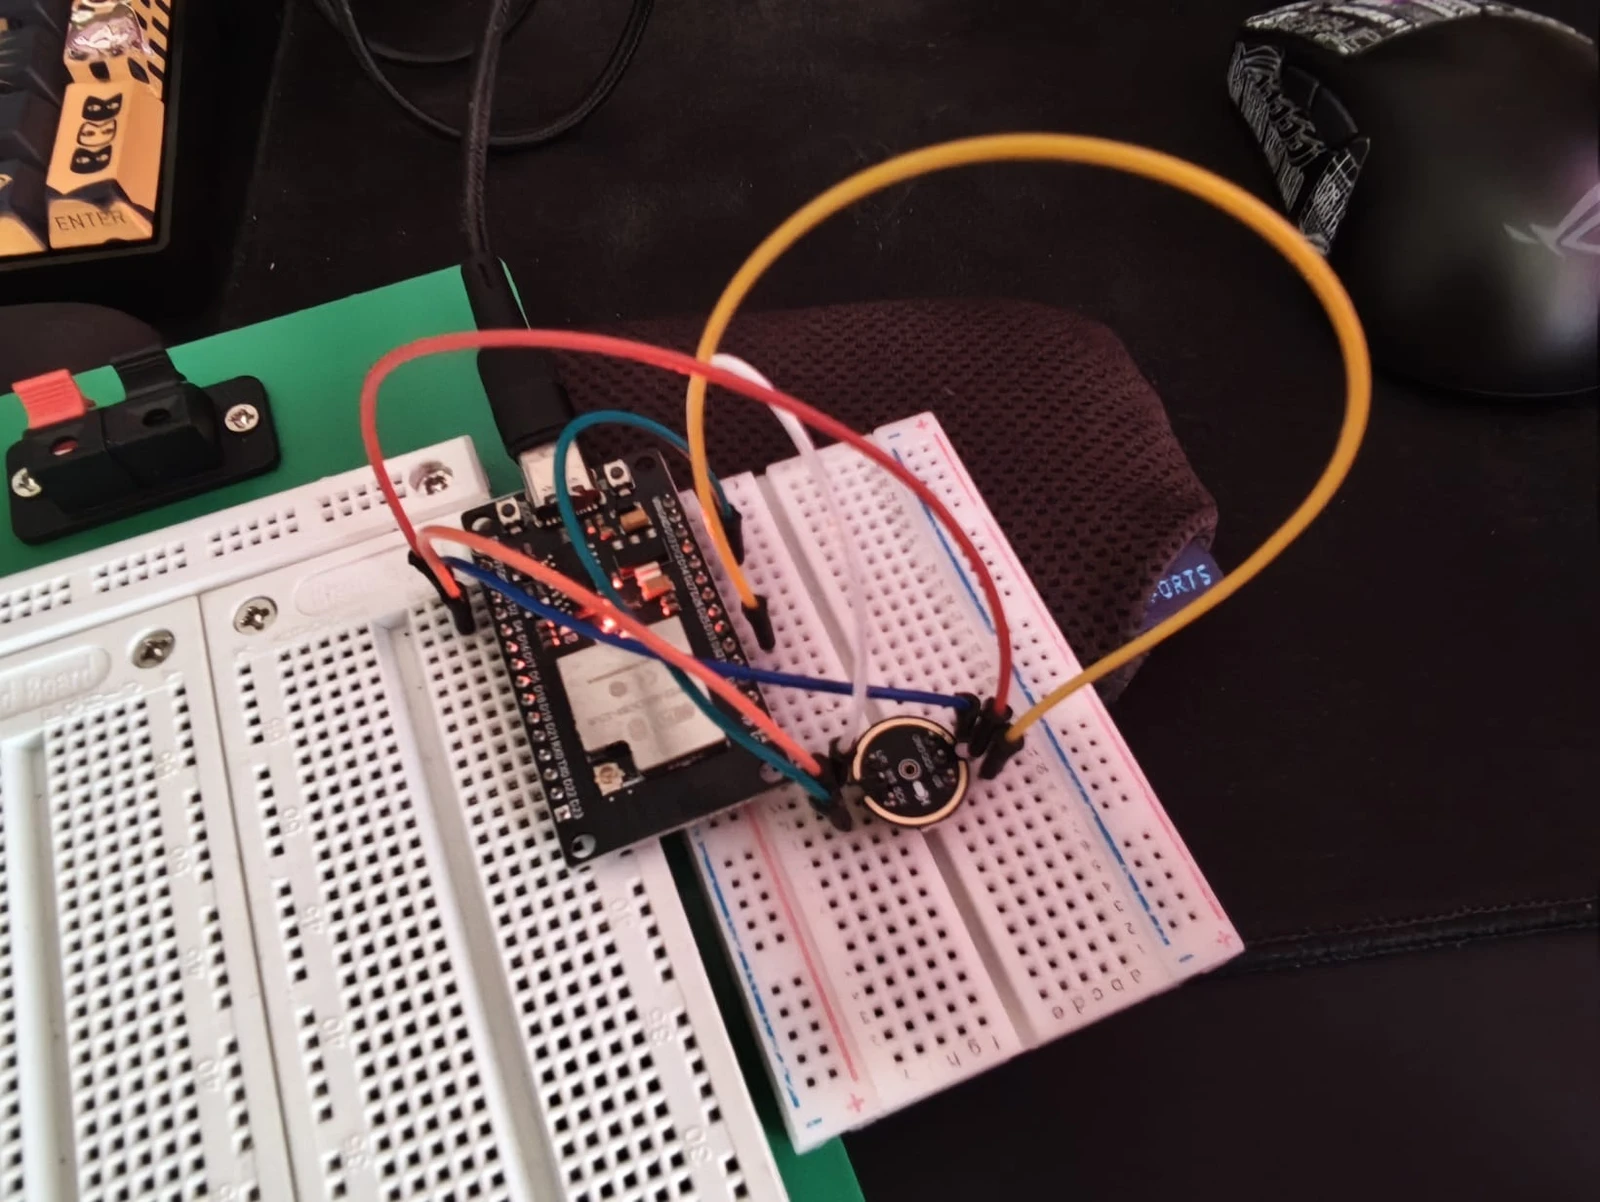
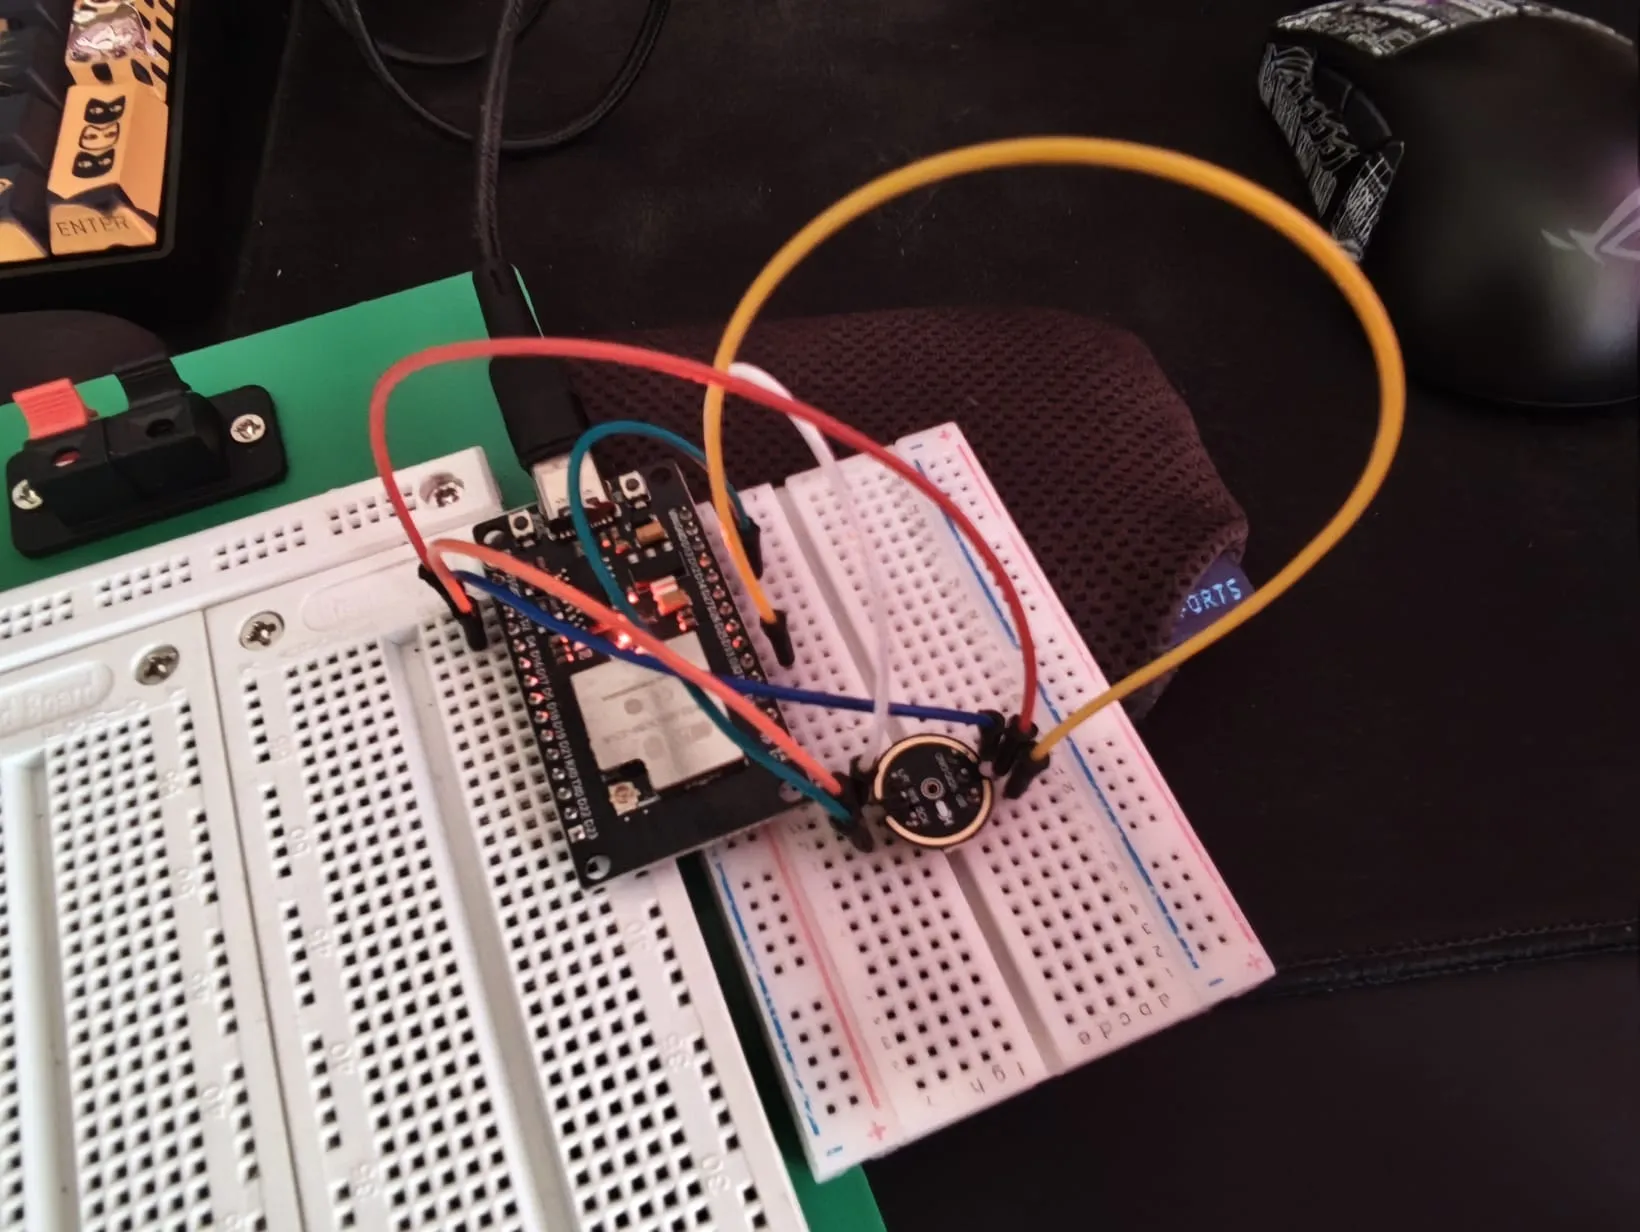
I wanted a way to see what my workspace actually sounds like — not just a number, but the full frequency picture. So I grabbed an INMP441 I2S microphone, wired it up to an ESP32, and wrote the FFT pipeline myself. The end result is a little device that sits on my desk, grabs audio in real time, runs a 512-point FFT, and streams everything to a browser dashboard over WiFi. It shows me the current dB level, a 64-bin spectrum bar chart, and a rolling 30-minute history of noise levels. It’s surprisingly addictive to watch — you really get a feel for which appliances are the loudest in the room.
System Architecture
INMP441 → I2S → ESP32 → FFT → WebSocket → Browser Dashboard
                                  │
                            Spectrum + dB + History
Pinout — INMP441 → ESP32
| INMP441 Pin | ESP32 Pin | Function |
|---|---|---|
| VDD | 3.3V | Power |
| GND | GND | Ground |
| SD | GPIO32 | I2S Serial Data |
| WS | GPIO15 | I2S Word Select (LRCLK) |
| SCK | GPIO14 | I2S Serial Clock |
| L/R | GND | Left channel (tie to GND) |
Key Features
- Real-time dB SPL reading with a status indicator that changes between Quiet, Normal, Warning, and Danger. I set the thresholds based on what felt right in my room — your mileage may vary.
- 64-bin frequency spectrum shown as animated bars, log-spaced from 20 Hz to 20 kHz. The log spacing matters a lot because our ears work that way — linear bins would waste most of the display on high frequencies we don’t care about.
- Dominant frequency detection — finds the loudest frequency in each frame. Handy for spotting things like a fridge compressor kicking in at a specific tone.
- Noise history with a 30-minute rolling buffer, sampled once per second. The ESP32 keeps all 1800 points in RAM and sends the most recent 600 to the browser so the JSON doesn’t get absurdly large.
- Calibration offset accessible from the web UI — useful because the INMP441 isn’t factory-calibrated for absolute SPL. I zero it against a phone app and call it close enough.
Web Dashboard
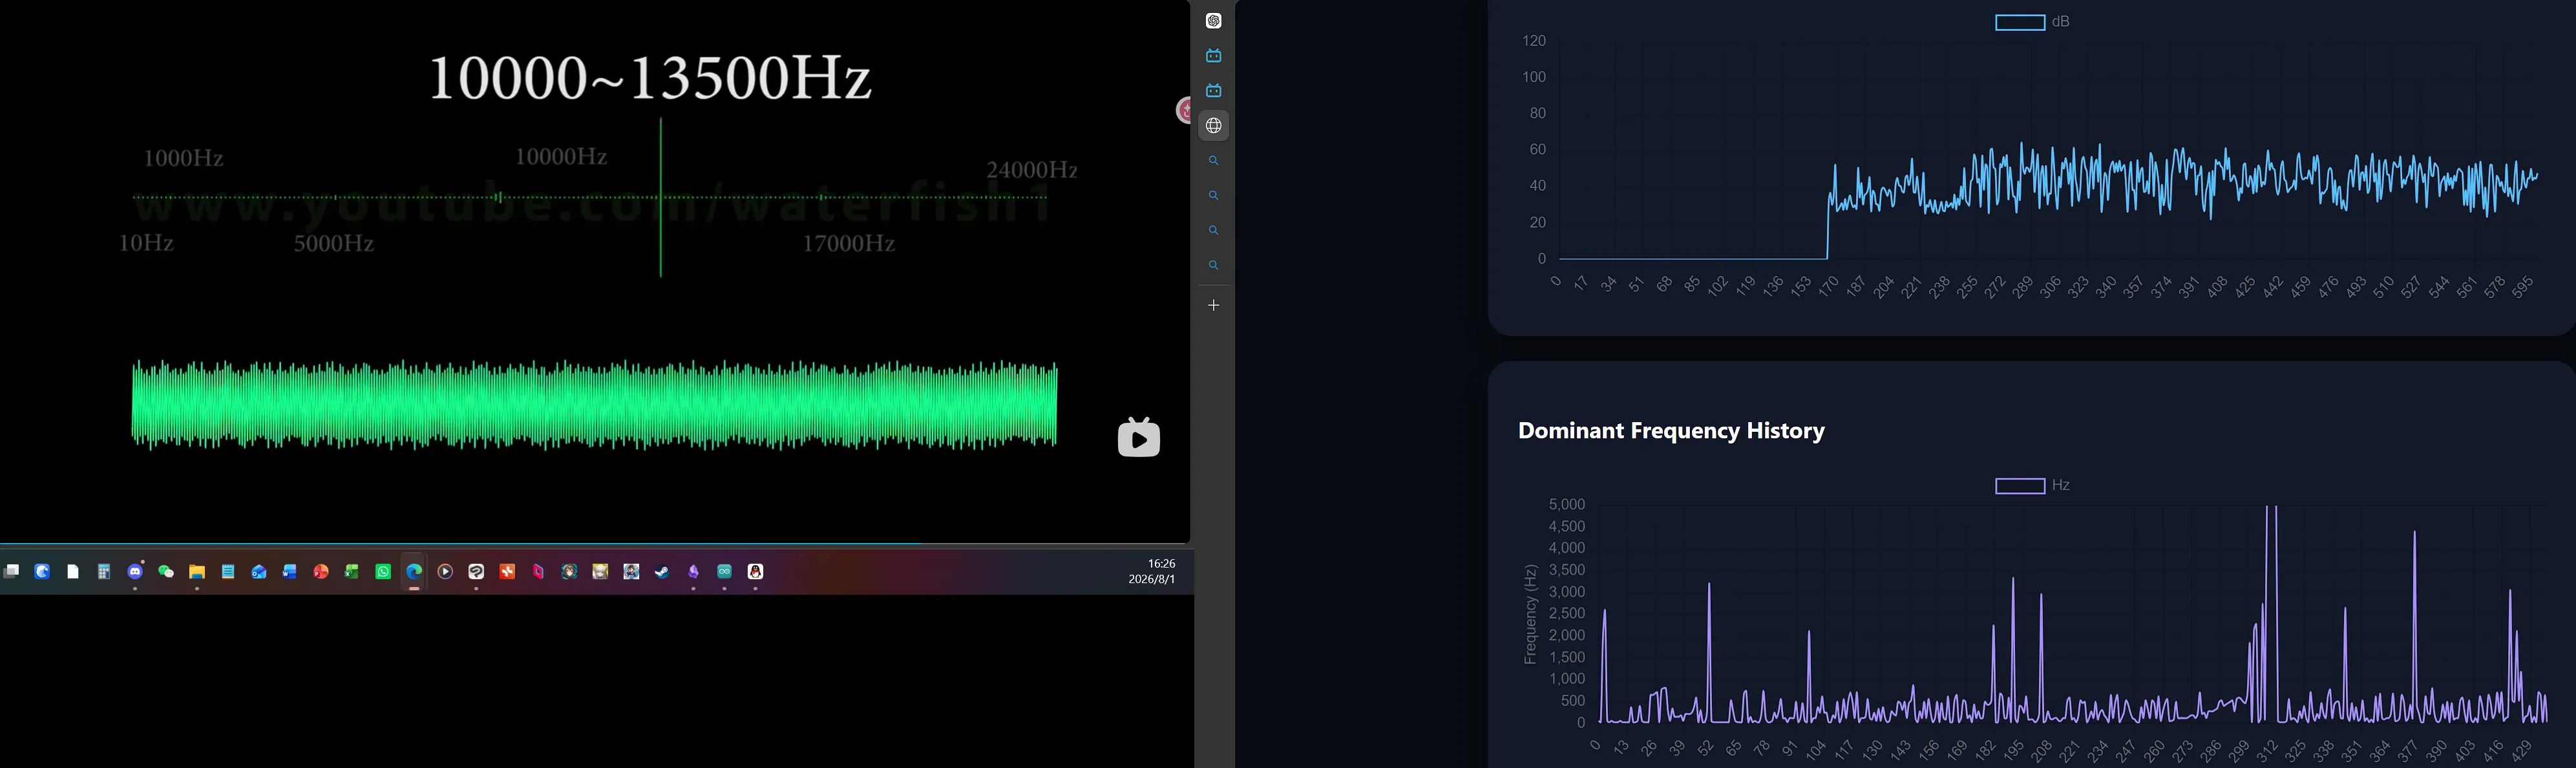
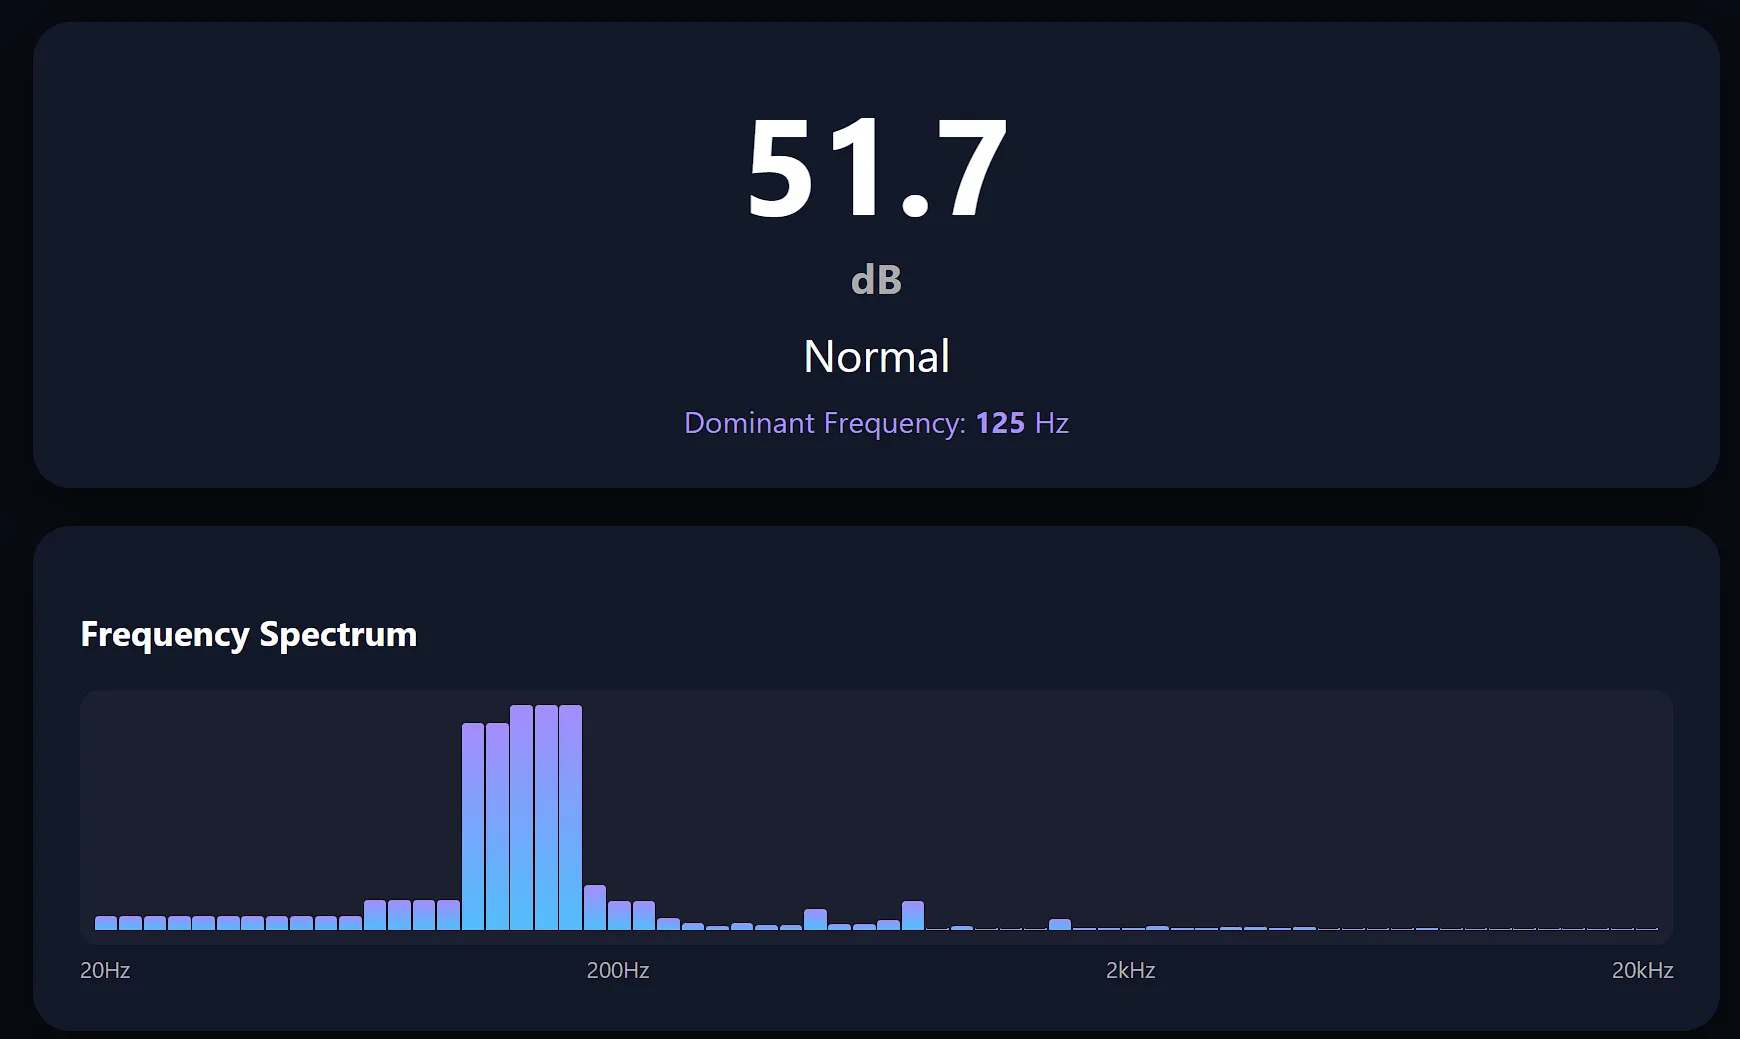
The dashboard runs entirely in the browser with Chart.js. No backend dependencies — the ESP32 serves the HTML and a /data JSON endpoint, and the JavaScript does the rest. It updates every second. One thing I learned: turn off Chart.js animations for this kind of streaming data, otherwise the browser chugs after a few minutes of redrawing.
Code Structure
Two files:
- Main.ino — I2S driver setup, audio capture loop, the FFT pipeline (Hamming window, complex-to-magnitude, log-spaced binning), WiFi server, and the JSON API that serves
/dataand/calibrate. - webpage.h — the entire HTML/CSS/JS dashboard packed into a
PROGMEMstring. Chart.js loaded from CDN, WebSocket-style polling viafetch(), and the spectrum bars are justdivelements with CSS transitions. No framework, no build step — just raw HTML that fits in the ESP32’s flash.
Full Code
// ============================================
// File 1: Main.h / Main.ino
// ============================================

#include <WiFi.h>
#include <WebServer.h>
#include <ArduinoJson.h>
#include "driver/i2s.h"
#include <arduinoFFT.h>
#include "webpage.h"

//====================
// WiFi
//====================

const char* ssid = "YOUR_WIFI_USERNAME_HERE";
const char* password = "YOUR_WIFI_PASSWORD_HERE";

WebServer server(80);

//====================
// INMP441 I2S Configuration
//====================

#define I2S_WS 15
#define I2S_SD 32
#define I2S_SCK 14

#define I2S_PORT I2S_NUM_0

//====================
// FFT Configuration
//====================

#define SAMPLES 512
#define SPECTRUM_BINS 64
#define SAMPLE_RATE 16000

double vReal[SAMPLES];
double vImag[SAMPLES];

ArduinoFFT<double> FFT(
  vReal,
  vImag,
  SAMPLES,
  SAMPLE_RATE
);

//====================
// Data variables
//====================

float dbValue = 0;

float lowEnergy = 0;
float spectrum[SPECTRUM_BINS];
float dominantFreq = 0;   // current dominant frequency (Hz)
float midEnergy = 0;
float highEnergy = 0;

// Calibration offset
float dbOffset = 0;

//====================
// History buffer
// 30 minutes at 1 sample/sec
//====================

#define HISTORY_SIZE 1800

float history[HISTORY_SIZE];
int historyIndex = 0;

unsigned long lastRecord = 0;

//====================
// Status
//====================

String noiseStatus = "Quiet";

//====================
// I2S Setup
//====================

void setupI2S() {
  i2s_config_t config = {
    .mode = (i2s_mode_t)(I2S_MODE_MASTER | I2S_MODE_RX),
    .sample_rate = SAMPLE_RATE,
    .bits_per_sample = I2S_BITS_PER_SAMPLE_32BIT,
    .channel_format = I2S_CHANNEL_FMT_ONLY_LEFT,
    .communication_format = I2S_COMM_FORMAT_STAND_I2S,
    .intr_alloc_flags = ESP_INTR_FLAG_LEVEL1,
    .dma_buf_count = 8,
    .dma_buf_len = 64,
    .use_apll = false,
    .tx_desc_auto_clear = false,
    .fixed_mclk = 0
  };

  i2s_pin_config_t pin = {
    .bck_io_num = I2S_SCK,
    .ws_io_num = I2S_WS,
    .data_out_num = I2S_PIN_NO_CHANGE,
    .data_in_num = I2S_SD
  };

  i2s_driver_install(I2S_PORT, &config, 0, NULL);
  i2s_set_pin(I2S_PORT, &pin);
  i2s_zero_dma_buffer(I2S_PORT);
}

//====================
// Read Audio Samples
//====================

void readAudio() {
  int32_t buffer[SAMPLES];
  size_t bytes;

  i2s_read(I2S_PORT, buffer, sizeof(buffer), &bytes, portMAX_DELAY);

  double sum = 0;

  for (int i = 0; i < SAMPLES; i++) {
    double sample = buffer[i] >> 14;
    vReal[i] = sample;
    vImag[i] = 0;
    sum += sample * sample;
  }

  double rms = sqrt(sum / SAMPLES);
  dbValue = 20 * log10(rms);
  dbValue += dbOffset;

  if (dbValue < 0) dbValue = 0;
  if (dbValue > 120) dbValue = 120;
}

//====================
// FFT Calculation
//====================

void calculateFFT() {
  FFT.windowing(FFTWindow::Hamming, FFTDirection::Forward);
  FFT.compute(FFTDirection::Forward);
  FFT.complexToMagnitude();

  // Calculate logarithmically distributed spectrum
  float logMin = log10(20);          // lowest frequency 20 Hz
  float logMax = log10(20000);       // highest frequency 20000 Hz
  float logStep = (logMax - logMin) / SPECTRUM_BINS;

  for (int i = 0; i < SPECTRUM_BINS; i++) {
    float freqStart = pow(10, logMin + i * logStep);
    float freqEnd   = pow(10, logMin + (i + 1) * logStep);
    int binStart = (int)(freqStart * SAMPLES / SAMPLE_RATE);
    int binEnd   = (int)(freqEnd   * SAMPLES / SAMPLE_RATE);
    binStart = constrain(binStart, 1, SAMPLES/2 - 1);
    binEnd   = constrain(binEnd,   binStart + 1, SAMPLES/2);
    if (binEnd <= binStart) binEnd = binStart + 1;

    float sum = 0;
    for (int j = binStart; j < binEnd; j++) {
      sum += vReal[j];
    }
    float avg = sum / (binEnd - binStart);
    // Map to 0-100; divisor can be adjusted based on testing (500 is empirical)
    spectrum[i] = constrain(avg / 500, 0, 100);
  }

  // Retain three legacy band values for compatibility
  lowEnergy = spectrum[0];   // simply use the first bin as approximation
  midEnergy = 0;
  highEnergy = 0;
  for (int i = 0; i < SPECTRUM_BINS; i++) {
    if (i < SPECTRUM_BINS/3) midEnergy += spectrum[i];
    else highEnergy += spectrum[i];
  }
  midEnergy = constrain(midEnergy / (SPECTRUM_BINS/3), 0, 100);
  highEnergy = constrain(highEnergy / (SPECTRUM_BINS*2/3), 0, 100);
}

// Get the frequency with the highest magnitude (fundamental frequency estimation)
float getDominantFrequency() {
  float maxMag = 0;
  int maxIdx = 1;  // skip DC component
  // Search from 20Hz to sample_rate/2
  int startBin = (20 * SAMPLES) / SAMPLE_RATE;
  if (startBin < 1) startBin = 1;
  for (int i = startBin; i < SAMPLES / 2; i++) {
    if (vReal[i] > maxMag) {
      maxMag = vReal[i];
      maxIdx = i;
    }
  }
  // Convert to frequency
  float freq = (maxIdx * 1.0 * SAMPLE_RATE) / SAMPLES;
  return freq;
}

//====================
// Status Update
//====================

void updateStatus() {
  if (dbValue < 50) {
    noiseStatus = "Quiet";
  } else if (dbValue < 70) {
    noiseStatus = "Normal";
  } else if (dbValue < 85) {
    noiseStatus = "Warning";
  } else {
    noiseStatus = "Danger";
  }
}

//====================
// History Recording
//====================

void saveHistory() {
  if (millis() - lastRecord > 1000) {
    history[historyIndex] = dbValue;
    historyIndex++;
    if (historyIndex >= HISTORY_SIZE) historyIndex = 0;
    lastRecord = millis();
  }
}

//============================
// JSON Data API
//============================

void handleData() {
  // Dynamic JSON document, 16KB enough for 64 spectrum values + 600 history points
  DynamicJsonDocument doc(16384);

  doc["db"] = dbValue;
  doc["status"] = noiseStatus;
  doc["freq"] = dominantFreq;
  doc["low"] = lowEnergy;     // kept for backward compatibility
  doc["mid"] = midEnergy;
  doc["high"] = highEnergy;

  // Send spectrum array
  JsonArray specArr = doc.createNestedArray("spectrum");
  for (int i = 0; i < SPECTRUM_BINS; i++) {
    specArr.add(spectrum[i]);
  }

  // Send history array (only the most recent 600 points to avoid oversized JSON)
  int sendCount = 600;
  int startIndex = (historyIndex - sendCount + HISTORY_SIZE) % HISTORY_SIZE;
  JsonArray arr = doc.createNestedArray("history");
  for (int i = 0; i < sendCount; i++) {
    int idx = (startIndex + i) % HISTORY_SIZE;
    arr.add(history[idx]);
  }

  String output;
  serializeJson(doc, output);
  server.send(200, "application/json", output);
}

//============================
// Calibration API
//============================

void handleCalibration() {
  if (server.hasArg("offset")) {
    dbOffset = server.arg("offset").toFloat();
  }
  server.send(200, "text/plain", "OK");
}

//============================
// Setup
//============================

void setup() {
  Serial.begin(115200);
  delay(1000);
  Serial.println();
  Serial.println("INMP441 Noise Monitor V2");

  // Initialize I2S
  setupI2S();

  // Connect WiFi
  WiFi.begin(ssid, password);
  Serial.print("Connecting WiFi");
  while (WiFi.status() != WL_CONNECTED) {
    delay(500);
    Serial.print(".");
  }
  Serial.println();
  Serial.println("WiFi Connected");
  Serial.print("IP Address: ");
  Serial.println(WiFi.localIP());

  // Web page
  server.on("/", []() {
    server.send(200, "text/html; charset=utf-8", webpage);
  });

  // Data API
  server.on("/data", handleData);

  // Calibration
  server.on("/calibrate", handleCalibration);

  server.begin();
  Serial.println("Web Server Started");
}

//============================
// Main Loop
//============================

void loop() {
  server.handleClient();
  readAudio();
  calculateFFT();
  dominantFreq = getDominantFrequency();
  updateStatus();
  saveHistory();
}


// ============================================
// File 2: webpage.h
// ============================================

#ifndef WEBPAGE_H
#define WEBPAGE_H

#include <Arduino.h>

const char webpage[] PROGMEM = R"WEBPAGE(
<!DOCTYPE html>
<html>
<head>
  <meta charset="UTF-8">
  <meta name="viewport" content="width=device-width,initial-scale=1">
  <title>Noise Monitor</title>
  <script src="https://cdn.jsdelivr.net/npm/chart.js"></script>
  <style>
    body {
      margin: 0;
      background: #080b12;
      font-family: "Segoe UI", Arial;
      color: white;
    }
    .container {
      max-width: 900px;
      margin: auto;
      padding: 20px;
    }
    .title {
      font-size: 28px;
      font-weight: 600;
    }
    .card {
      background: #111827;
      border-radius: 20px;
      padding: 25px;
      margin-top: 20px;
      box-shadow: 0 10px 30px #0008;
    }
    .db {
      font-size: 72px;
      font-weight: 700;
      text-align: center;
    }
    .unit {
      font-size: 22px;
      color: #aaa;
    }
    .status {
      text-align: center;
      font-size: 24px;
      margin-top: 10px;
    }
    button {
      background: #2563eb;
      border: 0;
      color: white;
      padding: 10px 20px;
      border-radius: 10px;
      cursor: pointer;
    }
    input {
      width: 80px;
      padding: 10px;
      border-radius: 8px;
      border: 0;
    }
    canvas {
      width: 100%;
      max-height: 250px;
    }
  </style>
</head>
<body>
  <div class="container">
    <div class="title">Ambient Noise Monitor</div>

    <!-- Real-time dB and status -->
    <div class="card">
      <div class="db">
        <span id="db">0</span>
        <div class="unit">dB</div>
      </div>
      <div class="status" id="status">Quiet</div>
      <div style="text-align:center; margin-top:10px; color:#a78bfa;">
        Dominant Frequency: <span id="freqDisplay" style="font-weight:bold;">--</span> Hz
      </div>
    </div>

    <!-- Frequency spectrum bar chart -->
    <div class="card">
      <h3>Frequency Spectrum</h3>
      <div id="spectrum-container" style="display:flex; align-items:flex-end; height:120px; gap:1px; background:#1a1f2e; border-radius:10px; padding:8px;">
        <!-- Bars generated dynamically by JS -->
      </div>
      <div style="display:flex; justify-content:space-between; font-size:12px; color:#aaa; margin-top:5px;">
        <span>20Hz</span><span>200Hz</span><span>2kHz</span><span>20kHz</span>
      </div>
    </div>

    <!-- dB history line chart -->
    <div class="card">
      <h3>Noise History (dB)</h3>
      <canvas id="dbChart"></canvas>
    </div>

    <!-- Dominant frequency history chart -->
    <div class="card">
      <h3>Dominant Frequency History</h3>
      <canvas id="freqChart"></canvas>
    </div>

    <!-- Calibration -->
    <div class="card">
      <h3>Calibration</h3>
      Current offset:
      <input id="offset" value="0">
      <button onclick="calibrate()">Save</button>
    </div>
  </div>

  <script>
    // ========== Initialize dB chart ==========
    const dbCtx = document.getElementById("dbChart").getContext("2d");
    const dbChart = new Chart(dbCtx, {
      type: "line",
      data: {
        labels: [],
        datasets: [{
          label: "dB",
          data: [],
          borderColor: "#38bdf8",
          borderWidth: 1.5,
          pointRadius: 0,         // hide data points for cleaner line
          tension: 0.3
        }]
      },
      options: {
        animation: false,
        scales: {
          y: { min: 0, max: 120 }
        }
      }
    });

    // ========== Initialize frequency chart ==========
    const freqCtx = document.getElementById("freqChart").getContext("2d");
    const freqChart = new Chart(freqCtx, {
      type: "line",
      data: {
        labels: [],
        datasets: [{
          label: "Hz",
          data: [],
          borderColor: "#a78bfa",
          borderWidth: 1.5,
          pointRadius: 0,         // also no data points
          tension: 0.3
        }]
      },
      options: {
        animation: false,
        scales: {
          y: {
            min: 0,
            max: 5000,            // typical human voice/music range; adjustable
            title: { display: true, text: "Frequency (Hz)" }
          }
        }
      }
    });

    // ========== Initialize spectrum bars ==========
    let spectrumBars = [];
    function initSpectrum(bins) {
      const container = document.getElementById("spectrum-container");
      container.innerHTML = "";
      spectrumBars = [];
      for (let i = 0; i < bins; i++) {
        const bar = document.createElement("div");
        bar.style.width = (100 / bins) + "%";
        bar.style.height = "0%";
        bar.style.background = "linear-gradient(to top, #38bdf8, #a78bfa)";
        bar.style.borderRadius = "2px 2px 0 0";
        bar.style.transition = "height 0.1s";
        container.appendChild(bar);
        spectrumBars.push(bar);
      }
    }
    setTimeout(() => initSpectrum(64), 100);

    // ========== Local history for frequency chart ==========
    const MAX_HISTORY = 600;
    let freqHistory = [];   // stores frequency values

    // ========== Periodic update ==========
    function update() {
      fetch("/data")
        .then(r => r.json())
        .then(d => {
          // Update dB
          document.getElementById("db").innerHTML = d.db.toFixed(1);
          document.getElementById("status").innerHTML = d.status;

          // Display current dominant frequency
          if (d.freq !== undefined) {
            document.getElementById("freqDisplay").textContent = d.freq.toFixed(0);
            // Add to local frequency history
            freqHistory.push(d.freq);
            if (freqHistory.length > MAX_HISTORY) {
              freqHistory.shift();  // keep max 600 entries
            }
            // Update frequency chart
            freqChart.data.labels = freqHistory.map((_, i) => i);
            freqChart.data.datasets[0].data = freqHistory;
            freqChart.update();
          }

          // Update spectrum bars
          if (d.spectrum && d.spectrum.length > 0) {
            for (let i = 0; i < spectrumBars.length && i < d.spectrum.length; i++) {
              spectrumBars[i].style.height = d.spectrum[i] + "%";
            }
          }

          // Update dB history chart
          dbChart.data.labels = d.history.map((_, i) => i);
          dbChart.data.datasets[0].data = d.history;
          dbChart.update();
        });
    }

    // Calibration function
    function calibrate() {
      let v = document.getElementById("offset").value;
      fetch("/calibrate?offset=" + v);
    }

    setInterval(update, 1000);
  </script>
</body>
</html>
)WEBPAGE";

#endif
Result
The ESP32 handles everything in a single loop — capture, FFT, serve HTTP — without any hiccups. I was half-expecting the WiFi stack and I2S DMA to step on each other’s toes, but the ESP32’s dual-core architecture keeps things clean even with the web server running on the same core as the audio pipeline. The dashboard updates at 1 Hz and the charts stay smooth. Not bad for a $5 microcontroller and a $3 microphone.
The one thing I’d improve next time: the INMP441’s onboard L/R pin ties it to left channel only, which is fine for mono, but if I ever want stereo I’ll need a second mic on a separate I2S bus. For now though, this does exactly what I wanted — it turns numbers into a picture of what my room sounds like.