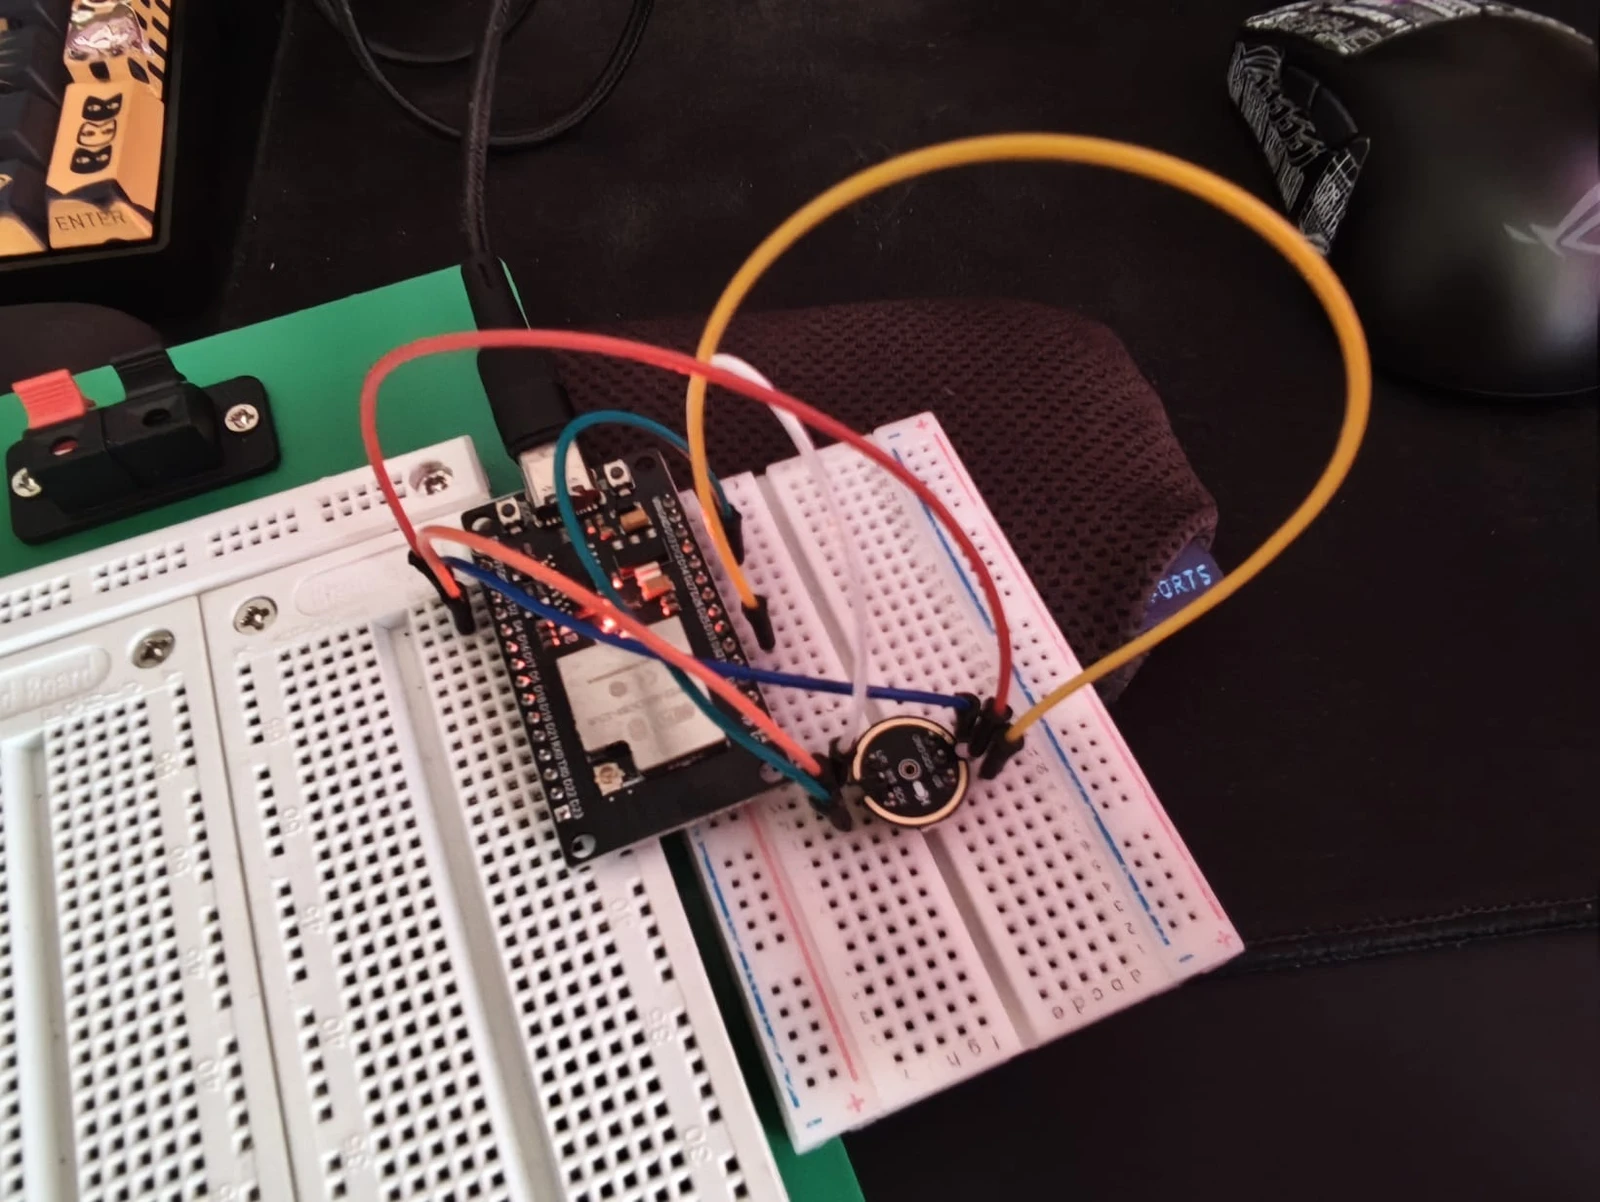
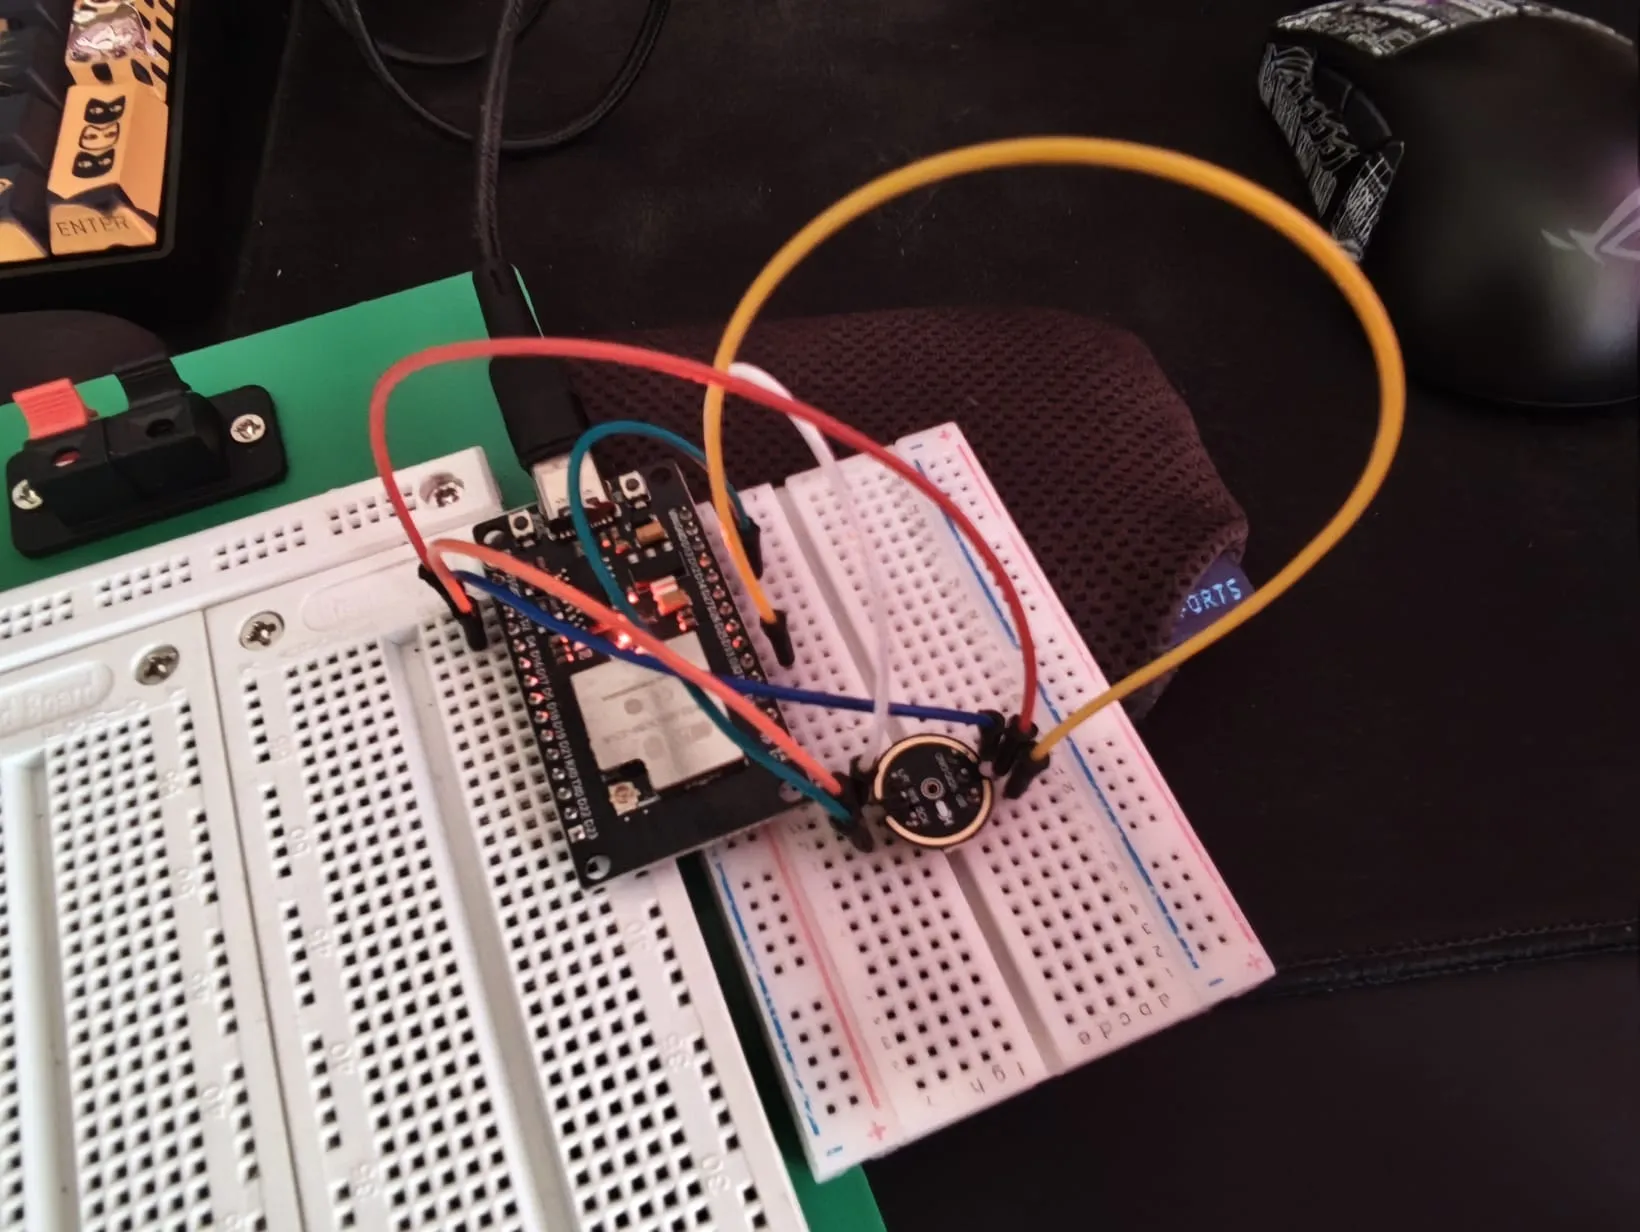
Overzicht
Ik wilde een manier om te zien hoe mijn werkplek eigenlijk klinkt: niet zomaar een getal, maar het volledige frequentiebeeld. Dus pakte ik een INMP441 I2S-microfoon, sloot die aan op een ESP32 en schreef ik zelf de FFT-pipeline. Het eindresultaat is een klein apparaatje dat op mijn bureau staat, audio in realtime binnenhaalt, een FFT van 512 punten draait en alles via WiFi naar een browserdashboard streamt. Het toont me het huidige dB-niveau, een staafdiagram van het 64-bins spectrum en een voortschrijdende geschiedenis van 30 minuten aan geluidsniveaus. Het is verrassend verslavend om naar te kijken: je krijgt echt een gevoel voor welke apparaten het luidst zijn in de kamer.
Systeemarchitectuur
INMP441 → I2S → ESP32 → FFT → WebSocket → Browser Dashboard
                                  │
                            Spectrum + dB + History
Pinout: INMP441 → ESP32
| INMP441-pin | ESP32-pin | Functie |
|---|---|---|
| VDD | 3.3V | Voeding |
| GND | GND | Massa |
| SD | GPIO32 | I2S seriële data |
| WS | GPIO15 | I2S Word Select (LRCLK) |
| SCK | GPIO14 | I2S seriële klok |
| L/R | GND | Linkerkanaal (verbinden met GND) |
Belangrijkste functies
- Realtime dB SPL-meting met een statusindicator die wisselt tussen Quiet, Normal, Warning en Danger. Ik heb de drempelwaarden ingesteld op basis van wat in mijn kamer goed aanvoelde: jouw ervaring kan anders zijn.
- Frequentiespectrum met 64 bins, getoond als geanimeerde balken, logaritmisch verdeeld van 20 Hz tot 20 kHz. De logaritmische verdeling is erg belangrijk omdat onze oren zo werken: lineaire bins zouden het grootste deel van het display verspillen aan hoge frequenties waar we niets om geven.
- Dominante frequentiedetectie: vindt de luidste frequentie in elk frame. Handig om dingen te spotten zoals een koelkastcompressor die op een specifieke toon aanslaat.
- Geluidsgeschiedenis met een voortschrijdende buffer van 30 minuten, één keer per seconde gesampled. De ESP32 houdt alle 1800 punten in het RAM en stuurt de meest recente 600 naar de browser, zodat de JSON niet absurd groot wordt.
- Kalibratie-offset toegankelijk vanuit de webinterface: nuttig omdat de INMP441 niet in de fabriek is gekalibreerd voor absolute SPL. Ik stel hem op nul af tegenover een telefoonapp en noem dat goed genoeg.
Webdashboard
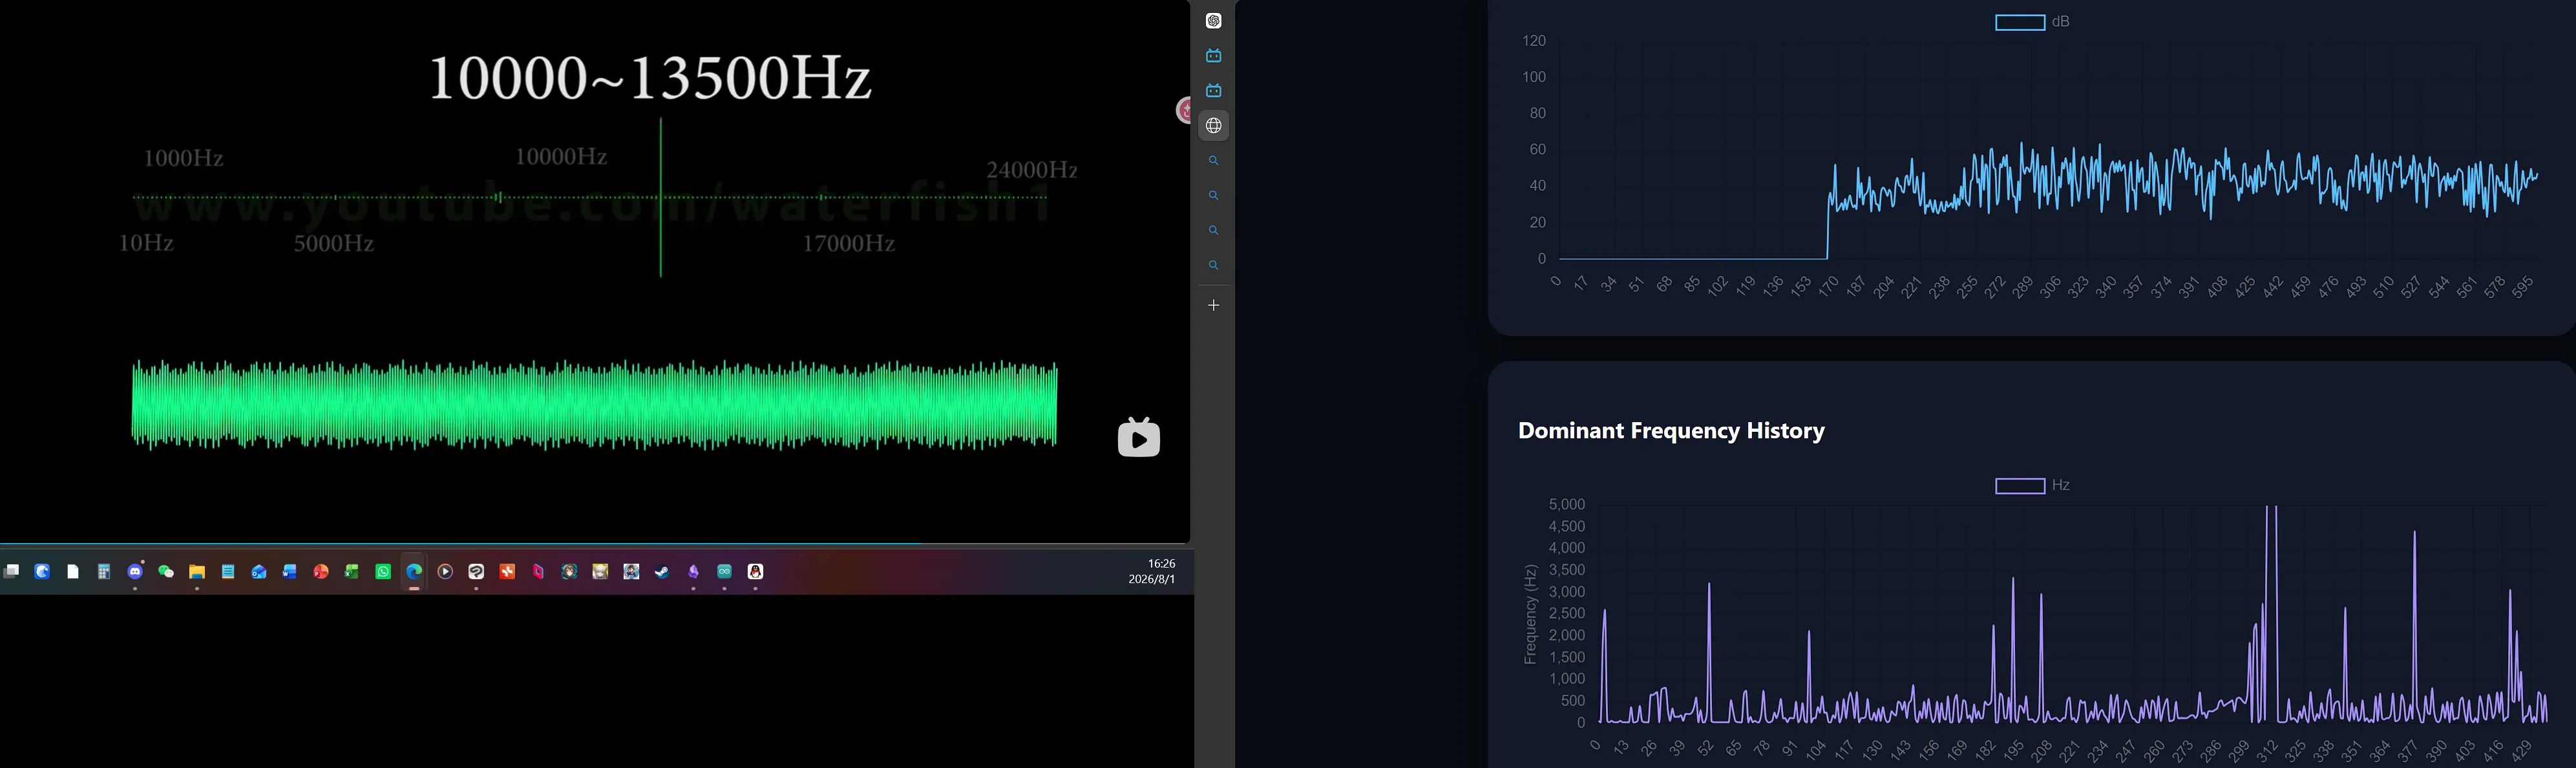
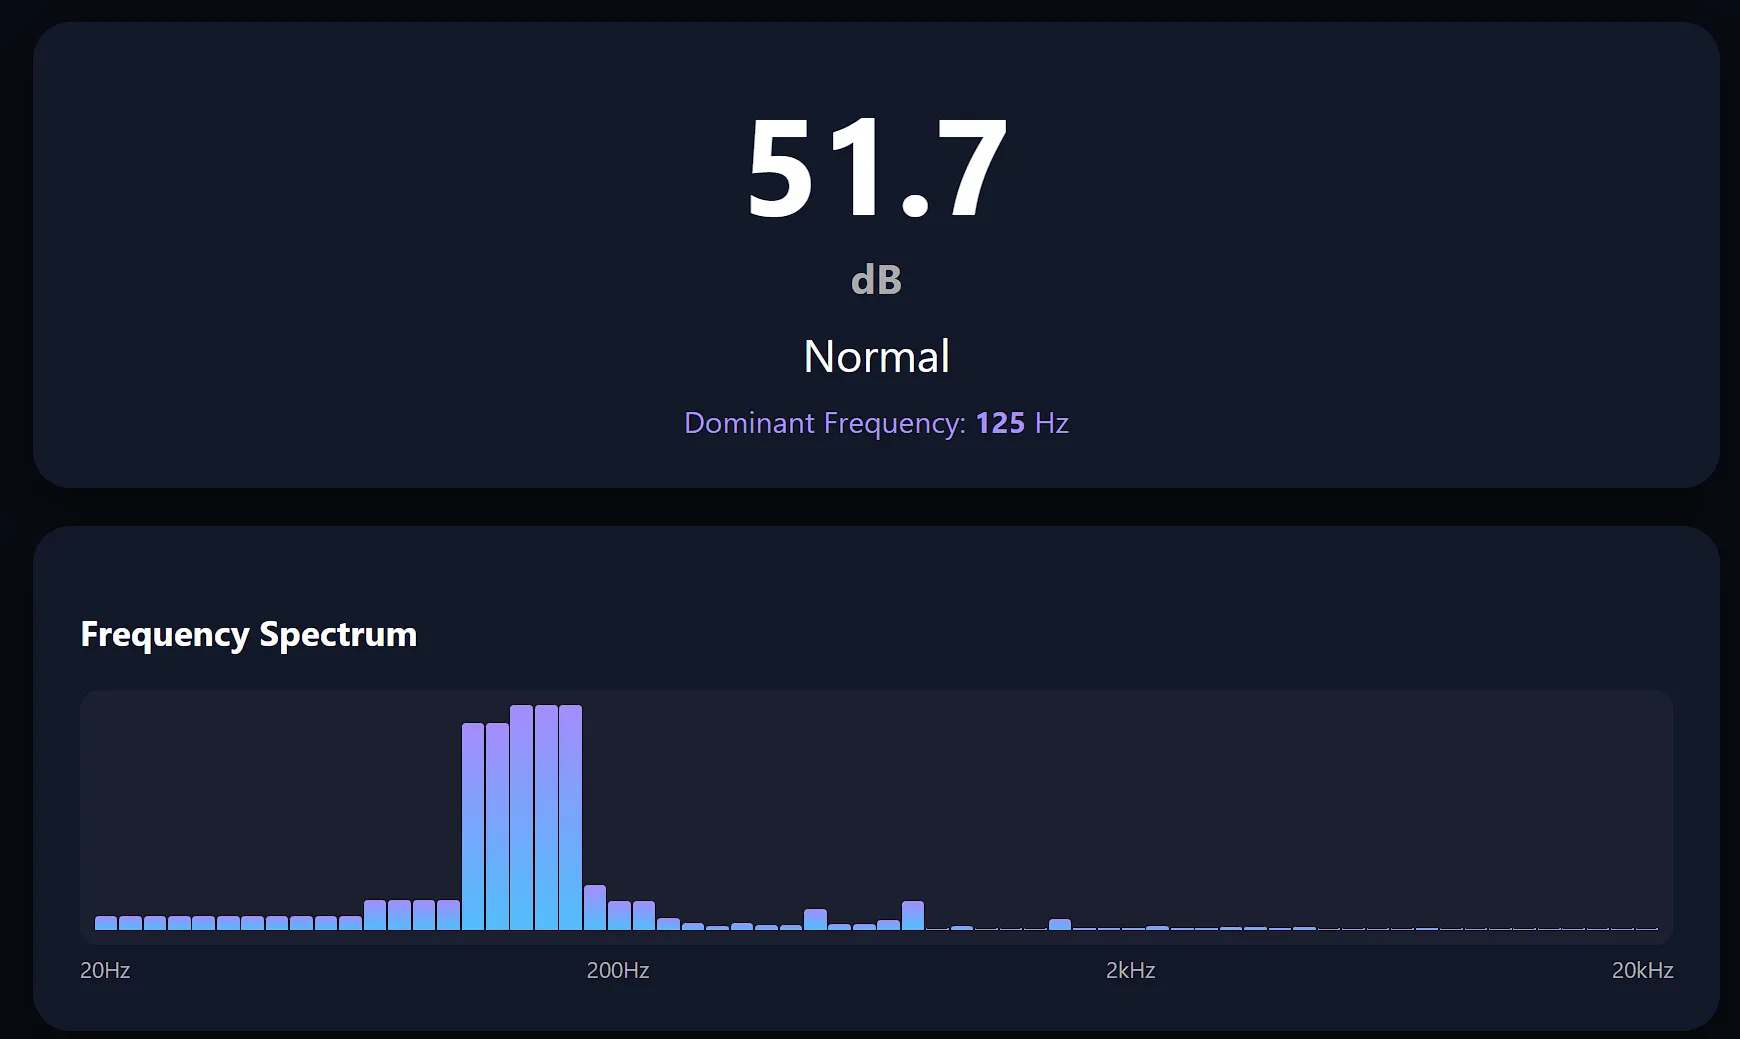
Het dashboard draait volledig in de browser met Chart.js. Geen backend-afhankelijkheden: de ESP32 serveert de HTML en een /data JSON-endpoint, en de JavaScript doet de rest. Het ververst elke seconde. Eén ding dat ik heb geleerd: schakel de Chart.js-animaties uit voor dit soort streaminggegevens, anders begint de browser na een paar minuten opnieuw tekenen te haperen.
Codestructuur
Twee bestanden:
- Main.ino: I2S-driverconfiguratie, audio-opnamelus, de FFT-pipeline (Hamming-venster, complex-naar-magnitude, logaritmisch verdeelde bins), de WiFi-server en de JSON API die
/dataen/calibrateserveert. - webpage.h: het volledige HTML/CSS/JS-dashboard verpakt in een
PROGMEM-string. Chart.js geladen vanaf een CDN, WebSocket-achtige polling viafetch(), en de spectrumbalken zijn gewoondiv-elementen met CSS-transities. Geen framework, geen build-stap: gewoon ruwe HTML die in het flashgeheugen van de ESP32 past.
Volledige code
// ============================================
// File 1: Main.h / Main.ino
// ============================================

#include <WiFi.h>
#include <WebServer.h>
#include <ArduinoJson.h>
#include "driver/i2s.h"
#include <arduinoFFT.h>
#include "webpage.h"

//====================
// WiFi
//====================

const char* ssid = "YOUR_WIFI_USERNAME_HERE";
const char* password = "YOUR_WIFI_PASSWORD_HERE";

WebServer server(80);

//====================
// INMP441 I2S Configuration
//====================

#define I2S_WS 15
#define I2S_SD 32
#define I2S_SCK 14

#define I2S_PORT I2S_NUM_0

//====================
// FFT Configuration
//====================

#define SAMPLES 512
#define SPECTRUM_BINS 64
#define SAMPLE_RATE 16000

double vReal[SAMPLES];
double vImag[SAMPLES];

ArduinoFFT<double> FFT(
  vReal,
  vImag,
  SAMPLES,
  SAMPLE_RATE
);

//====================
// Data variables
//====================

float dbValue = 0;

float lowEnergy = 0;
float spectrum[SPECTRUM_BINS];
float dominantFreq = 0;   // current dominant frequency (Hz)
float midEnergy = 0;
float highEnergy = 0;

// Calibration offset
float dbOffset = 0;

//====================
// History buffer
// 30 minutes at 1 sample/sec
//====================

#define HISTORY_SIZE 1800

float history[HISTORY_SIZE];
int historyIndex = 0;

unsigned long lastRecord = 0;

//====================
// Status
//====================

String noiseStatus = "Quiet";

//====================
// I2S Setup
//====================

void setupI2S() {
  i2s_config_t config = {
    .mode = (i2s_mode_t)(I2S_MODE_MASTER | I2S_MODE_RX),
    .sample_rate = SAMPLE_RATE,
    .bits_per_sample = I2S_BITS_PER_SAMPLE_32BIT,
    .channel_format = I2S_CHANNEL_FMT_ONLY_LEFT,
    .communication_format = I2S_COMM_FORMAT_STAND_I2S,
    .intr_alloc_flags = ESP_INTR_FLAG_LEVEL1,
    .dma_buf_count = 8,
    .dma_buf_len = 64,
    .use_apll = false,
    .tx_desc_auto_clear = false,
    .fixed_mclk = 0
  };

  i2s_pin_config_t pin = {
    .bck_io_num = I2S_SCK,
    .ws_io_num = I2S_WS,
    .data_out_num = I2S_PIN_NO_CHANGE,
    .data_in_num = I2S_SD
  };

  i2s_driver_install(I2S_PORT, &config, 0, NULL);
  i2s_set_pin(I2S_PORT, &pin);
  i2s_zero_dma_buffer(I2S_PORT);
}

//====================
// Read Audio Samples
//====================

void readAudio() {
  int32_t buffer[SAMPLES];
  size_t bytes;

  i2s_read(I2S_PORT, buffer, sizeof(buffer), &bytes, portMAX_DELAY);

  double sum = 0;

  for (int i = 0; i < SAMPLES; i++) {
    double sample = buffer[i] >> 14;
    vReal[i] = sample;
    vImag[i] = 0;
    sum += sample * sample;
  }

  double rms = sqrt(sum / SAMPLES);
  dbValue = 20 * log10(rms);
  dbValue += dbOffset;

  if (dbValue < 0) dbValue = 0;
  if (dbValue > 120) dbValue = 120;
}

//====================
// FFT Calculation
//====================

void calculateFFT() {
  FFT.windowing(FFTWindow::Hamming, FFTDirection::Forward);
  FFT.compute(FFTDirection::Forward);
  FFT.complexToMagnitude();

  // Calculate logarithmically distributed spectrum
  float logMin = log10(20);          // lowest frequency 20 Hz
  float logMax = log10(20000);       // highest frequency 20000 Hz
  float logStep = (logMax - logMin) / SPECTRUM_BINS;

  for (int i = 0; i < SPECTRUM_BINS; i++) {
    float freqStart = pow(10, logMin + i * logStep);
    float freqEnd   = pow(10, logMin + (i + 1) * logStep);
    int binStart = (int)(freqStart * SAMPLES / SAMPLE_RATE);
    int binEnd   = (int)(freqEnd   * SAMPLES / SAMPLE_RATE);
    binStart = constrain(binStart, 1, SAMPLES/2 - 1);
    binEnd   = constrain(binEnd,   binStart + 1, SAMPLES/2);
    if (binEnd <= binStart) binEnd = binStart + 1;

    float sum = 0;
    for (int j = binStart; j < binEnd; j++) {
      sum += vReal[j];
    }
    float avg = sum / (binEnd - binStart);
    // Map to 0-100; divisor can be adjusted based on testing (500 is empirical)
    spectrum[i] = constrain(avg / 500, 0, 100);
  }

  // Retain three legacy band values for compatibility
  lowEnergy = spectrum[0];   // simply use the first bin as approximation
  midEnergy = 0;
  highEnergy = 0;
  for (int i = 0; i < SPECTRUM_BINS; i++) {
    if (i < SPECTRUM_BINS/3) midEnergy += spectrum[i];
    else highEnergy += spectrum[i];
  }
  midEnergy = constrain(midEnergy / (SPECTRUM_BINS/3), 0, 100);
  highEnergy = constrain(highEnergy / (SPECTRUM_BINS*2/3), 0, 100);
}

// Get the frequency with the highest magnitude (fundamental frequency estimation)
float getDominantFrequency() {
  float maxMag = 0;
  int maxIdx = 1;  // skip DC component
  // Search from 20Hz to sample_rate/2
  int startBin = (20 * SAMPLES) / SAMPLE_RATE;
  if (startBin < 1) startBin = 1;
  for (int i = startBin; i < SAMPLES / 2; i++) {
    if (vReal[i] > maxMag) {
      maxMag = vReal[i];
      maxIdx = i;
    }
  }
  // Convert to frequency
  float freq = (maxIdx * 1.0 * SAMPLE_RATE) / SAMPLES;
  return freq;
}

//====================
// Status Update
//====================

void updateStatus() {
  if (dbValue < 50) {
    noiseStatus = "Quiet";
  } else if (dbValue < 70) {
    noiseStatus = "Normal";
  } else if (dbValue < 85) {
    noiseStatus = "Warning";
  } else {
    noiseStatus = "Danger";
  }
}

//====================
// History Recording
//====================

void saveHistory() {
  if (millis() - lastRecord > 1000) {
    history[historyIndex] = dbValue;
    historyIndex++;
    if (historyIndex >= HISTORY_SIZE) historyIndex = 0;
    lastRecord = millis();
  }
}

//============================
// JSON Data API
//============================

void handleData() {
  // Dynamic JSON document, 16KB enough for 64 spectrum values + 600 history points
  DynamicJsonDocument doc(16384);

  doc["db"] = dbValue;
  doc["status"] = noiseStatus;
  doc["freq"] = dominantFreq;
  doc["low"] = lowEnergy;     // kept for backward compatibility
  doc["mid"] = midEnergy;
  doc["high"] = highEnergy;

  // Send spectrum array
  JsonArray specArr = doc.createNestedArray("spectrum");
  for (int i = 0; i < SPECTRUM_BINS; i++) {
    specArr.add(spectrum[i]);
  }

  // Send history array (only the most recent 600 points to avoid oversized JSON)
  int sendCount = 600;
  int startIndex = (historyIndex - sendCount + HISTORY_SIZE) % HISTORY_SIZE;
  JsonArray arr = doc.createNestedArray("history");
  for (int i = 0; i < sendCount; i++) {
    int idx = (startIndex + i) % HISTORY_SIZE;
    arr.add(history[idx]);
  }

  String output;
  serializeJson(doc, output);
  server.send(200, "application/json", output);
}

//============================
// Calibration API
//============================

void handleCalibration() {
  if (server.hasArg("offset")) {
    dbOffset = server.arg("offset").toFloat();
  }
  server.send(200, "text/plain", "OK");
}

//============================
// Setup
//============================

void setup() {
  Serial.begin(115200);
  delay(1000);
  Serial.println();
  Serial.println("INMP441 Noise Monitor V2");

  // Initialize I2S
  setupI2S();

  // Connect WiFi
  WiFi.begin(ssid, password);
  Serial.print("Connecting WiFi");
  while (WiFi.status() != WL_CONNECTED) {
    delay(500);
    Serial.print(".");
  }
  Serial.println();
  Serial.println("WiFi Connected");
  Serial.print("IP Address: ");
  Serial.println(WiFi.localIP());

  // Web page
  server.on("/", []() {
    server.send(200, "text/html; charset=utf-8", webpage);
  });

  // Data API
  server.on("/data", handleData);

  // Calibration
  server.on("/calibrate", handleCalibration);

  server.begin();
  Serial.println("Web Server Started");
}

//============================
// Main Loop
//============================

void loop() {
  server.handleClient();
  readAudio();
  calculateFFT();
  dominantFreq = getDominantFrequency();
  updateStatus();
  saveHistory();
}


// ============================================
// File 2: webpage.h
// ============================================

#ifndef WEBPAGE_H
#define WEBPAGE_H

#include <Arduino.h>

const char webpage[] PROGMEM = R"WEBPAGE(
<!DOCTYPE html>
<html>
<head>
  <meta charset="UTF-8">
  <meta name="viewport" content="width=device-width,initial-scale=1">
  <title>Noise Monitor</title>
  <script src="https://cdn.jsdelivr.net/npm/chart.js"></script>
  <style>
    body {
      margin: 0;
      background: #080b12;
      font-family: "Segoe UI", Arial;
      color: white;
    }
    .container {
      max-width: 900px;
      margin: auto;
      padding: 20px;
    }
    .title {
      font-size: 28px;
      font-weight: 600;
    }
    .card {
      background: #111827;
      border-radius: 20px;
      padding: 25px;
      margin-top: 20px;
      box-shadow: 0 10px 30px #0008;
    }
    .db {
      font-size: 72px;
      font-weight: 700;
      text-align: center;
    }
    .unit {
      font-size: 22px;
      color: #aaa;
    }
    .status {
      text-align: center;
      font-size: 24px;
      margin-top: 10px;
    }
    button {
      background: #2563eb;
      border: 0;
      color: white;
      padding: 10px 20px;
      border-radius: 10px;
      cursor: pointer;
    }
    input {
      width: 80px;
      padding: 10px;
      border-radius: 8px;
      border: 0;
    }
    canvas {
      width: 100%;
      max-height: 250px;
    }
  </style>
</head>
<body>
  <div class="container">
    <div class="title">Ambient Noise Monitor</div>

    <!-- Real-time dB and status -->
    <div class="card">
      <div class="db">
        <span id="db">0</span>
        <div class="unit">dB</div>
      </div>
      <div class="status" id="status">Quiet</div>
      <div style="text-align:center; margin-top:10px; color:#a78bfa;">
        Dominant Frequency: <span id="freqDisplay" style="font-weight:bold;">--</span> Hz
      </div>
    </div>

    <!-- Frequency spectrum bar chart -->
    <div class="card">
      <h3>Frequency Spectrum</h3>
      <div id="spectrum-container" style="display:flex; align-items:flex-end; height:120px; gap:1px; background:#1a1f2e; border-radius:10px; padding:8px;">
        <!-- Bars generated dynamically by JS -->
      </div>
      <div style="display:flex; justify-content:space-between; font-size:12px; color:#aaa; margin-top:5px;">
        <span>20Hz</span><span>200Hz</span><span>2kHz</span><span>20kHz</span>
      </div>
    </div>

    <!-- dB history line chart -->
    <div class="card">
      <h3>Noise History (dB)</h3>
      <canvas id="dbChart"></canvas>
    </div>

    <!-- Dominant frequency history chart -->
    <div class="card">
      <h3>Dominant Frequency History</h3>
      <canvas id="freqChart"></canvas>
    </div>

    <!-- Calibration -->
    <div class="card">
      <h3>Calibration</h3>
      Current offset:
      <input id="offset" value="0">
      <button onclick="calibrate()">Save</button>
    </div>
  </div>

  <script>
    // ========== Initialize dB chart ==========
    const dbCtx = document.getElementById("dbChart").getContext("2d");
    const dbChart = new Chart(dbCtx, {
      type: "line",
      data: {
        labels: [],
        datasets: [{
          label: "dB",
          data: [],
          borderColor: "#38bdf8",
          borderWidth: 1.5,
          pointRadius: 0,         // hide data points for cleaner line
          tension: 0.3
        }]
      },
      options: {
        animation: false,
        scales: {
          y: { min: 0, max: 120 }
        }
      }
    });

    // ========== Initialize frequency chart ==========
    const freqCtx = document.getElementById("freqChart").getContext("2d");
    const freqChart = new Chart(freqCtx, {
      type: "line",
      data: {
        labels: [],
        datasets: [{
          label: "Hz",
          data: [],
          borderColor: "#a78bfa",
          borderWidth: 1.5,
          pointRadius: 0,         // also no data points
          tension: 0.3
        }]
      },
      options: {
        animation: false,
        scales: {
          y: {
            min: 0,
            max: 5000,            // typical human voice/music range; adjustable
            title: { display: true, text: "Frequency (Hz)" }
          }
        }
      }
    });

    // ========== Initialize spectrum bars ==========
    let spectrumBars = [];
    function initSpectrum(bins) {
      const container = document.getElementById("spectrum-container");
      container.innerHTML = "";
      spectrumBars = [];
      for (let i = 0; i < bins; i++) {
        const bar = document.createElement("div");
        bar.style.width = (100 / bins) + "%";
        bar.style.height = "0%";
        bar.style.background = "linear-gradient(to top, #38bdf8, #a78bfa)";
        bar.style.borderRadius = "2px 2px 0 0";
        bar.style.transition = "height 0.1s";
        container.appendChild(bar);
        spectrumBars.push(bar);
      }
    }
    setTimeout(() => initSpectrum(64), 100);

    // ========== Local history for frequency chart ==========
    const MAX_HISTORY = 600;
    let freqHistory = [];   // stores frequency values

    // ========== Periodic update ==========
    function update() {
      fetch("/data")
        .then(r => r.json())
        .then(d => {
          // Update dB
          document.getElementById("db").innerHTML = d.db.toFixed(1);
          document.getElementById("status").innerHTML = d.status;

          // Display current dominant frequency
          if (d.freq !== undefined) {
            document.getElementById("freqDisplay").textContent = d.freq.toFixed(0);
            // Add to local frequency history
            freqHistory.push(d.freq);
            if (freqHistory.length > MAX_HISTORY) {
              freqHistory.shift();  // keep max 600 entries
            }
            // Update frequency chart
            freqChart.data.labels = freqHistory.map((_, i) => i);
            freqChart.data.datasets[0].data = freqHistory;
            freqChart.update();
          }

          // Update spectrum bars
          if (d.spectrum && d.spectrum.length > 0) {
            for (let i = 0; i < spectrumBars.length && i < d.spectrum.length; i++) {
              spectrumBars[i].style.height = d.spectrum[i] + "%";
            }
          }

          // Update dB history chart
          dbChart.data.labels = d.history.map((_, i) => i);
          dbChart.data.datasets[0].data = d.history;
          dbChart.update();
        });
    }

    // Calibration function
    function calibrate() {
      let v = document.getElementById("offset").value;
      fetch("/calibrate?offset=" + v);
    }

    setInterval(update, 1000);
  </script>
</body>
</html>
)WEBPAGE";

#endif
Resultaat
De ESP32 handelt alles af in één lus: opnemen, FFT, HTTP serveren, zonder enige hapering. Ik verwachtte half dat de WiFi-stack en de I2S-DMA elkaar in de weg zouden zitten, maar de dual-corearchitectuur van de ESP32 houdt alles netjes, zelfs met de webserver op dezelfde core als de audiopipeline. Het dashboard ververst op 1 Hz en de grafieken blijven vloeiend. Niet slecht voor een microcontroller van $5 en een microfoon van $3.
Het enige dat ik de volgende keer zou verbeteren: de ingebouwde L/R-pin van de INMP441 bindt hem aan alleen het linkerkanaal, wat prima is voor mono, maar als ik ooit stereo wil, heb ik een tweede microfoon op een aparte I2S-bus nodig. Voor nu doet het echter precies wat ik wilde: het zet getallen om in een beeld van hoe mijn kamer klinkt.